Worldwide computer server shipments increased 2.8 percent to 2.5 million units in 4Q14 when compared with the same year-ago period, according to the latest market study by International Data Corporation (IDC). Growth was due to an ongoing enterprise data center refresh cycle, coupled with infrastructure investments by public cloud computing service providers.
For the full year 2014, worldwide server revenue increased 2.3 percent to $50.9 billion when compared to 2013, while worldwide unit shipments increased 2.9 percent to 9.2 million units, a record high.
On a year-over-year basis, volume system revenue increased 4.9 percent and mid-range system demand increased 21.2 percent in 4Q14 to $10.8 billion and $1.4 billion, respectively.
The volume segment was aided by a continued expansion of x86-based hyperscale open server infrastructures while mid-range systems were helped by enterprise investment in scalable systems for virtualization and consolidation.
"Public cloud service providers continue their hyperscale deployment march as both large and mid-sized service providers expand their data center footprints to meet growing cloud computing services demand, led by cloud hosting services," said Kuba Stolarski, research manager at IDC.
Open server demand will continue in hyperscale data centers. Moreover, as demand for the Internet of Things grows -- generating big data applications, increased network traffic, and use-cases for real-time analytics -- new methods of deploying open-source compute and storage capability will continue the scale-out transformation.
Additional Server Market Study Findings Include:
For the full year 2014, worldwide server revenue increased 2.3 percent to $50.9 billion when compared to 2013, while worldwide unit shipments increased 2.9 percent to 9.2 million units, a record high.
On a year-over-year basis, volume system revenue increased 4.9 percent and mid-range system demand increased 21.2 percent in 4Q14 to $10.8 billion and $1.4 billion, respectively.
The volume segment was aided by a continued expansion of x86-based hyperscale open server infrastructures while mid-range systems were helped by enterprise investment in scalable systems for virtualization and consolidation.
"Public cloud service providers continue their hyperscale deployment march as both large and mid-sized service providers expand their data center footprints to meet growing cloud computing services demand, led by cloud hosting services," said Kuba Stolarski, research manager at IDC.
Open server demand will continue in hyperscale data centers. Moreover, as demand for the Internet of Things grows -- generating big data applications, increased network traffic, and use-cases for real-time analytics -- new methods of deploying open-source compute and storage capability will continue the scale-out transformation.
Additional Server Market Study Findings Include:
- Regionally, Asia-Pacific experienced the sharpest revenue growth with a year-over-year increase of 15.8 percent in 4Q14. Europe, Middle East and Africa (EMEA), Japan, and the United States also experienced positive year-over-year growth of 1.2, 1.5, and 1.0 percent, respectively.
- China once again exhibited significant growth with year-over-year revenue up 26.2 percent to $2.0 billion. The top 4 Chinese OEMs – Inspur, Huawei, Lenovo, and Sugon – all grew revenue by more than 50 percent on a year-over-year basis as the China market crossed the $2 billion quarterly revenue threshold for the first time.
- Demand for x86 servers improved in 4Q14 with revenues increasing 7.1 percent year over year in the quarter to $11.5 billion worldwide as unit shipments increased 2.9 percent to 2.5 million servers.
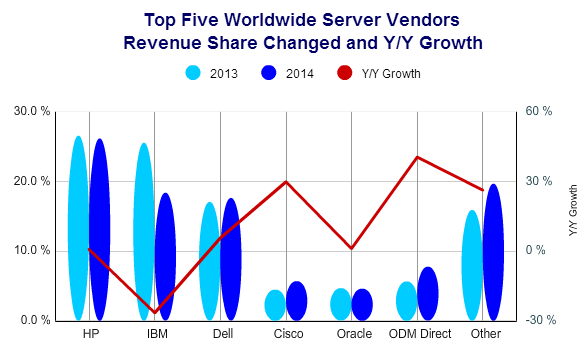
- HP led the market with 31.3 percent revenue share based on 4.6 percent revenue growth over 4Q13. Dell retained second place, securing 21.1 percent revenue share following 11.9 percent year over year revenue growth.
- Non-x86 servers experienced a revenue decline of -14.0 percent year over year to $3.0 billion, representing 20.7 percent of quarterly server revenue. This was the fourteenth consecutive quarter of revenue decline in the non-x86 server segment.
- IBM leads the segment with 66.1 percent revenue share following a year-over-year revenue decrease of -19.2 percent when compared with the fourth quarter of 2013.
- IDC also began to see early stage revenue from ARM server sales in 4Q14 largely the result of HP Moonshot system deployments.